Market News, Sellers, Buyers
Last Updated: Jan 08, 2021
December 2020
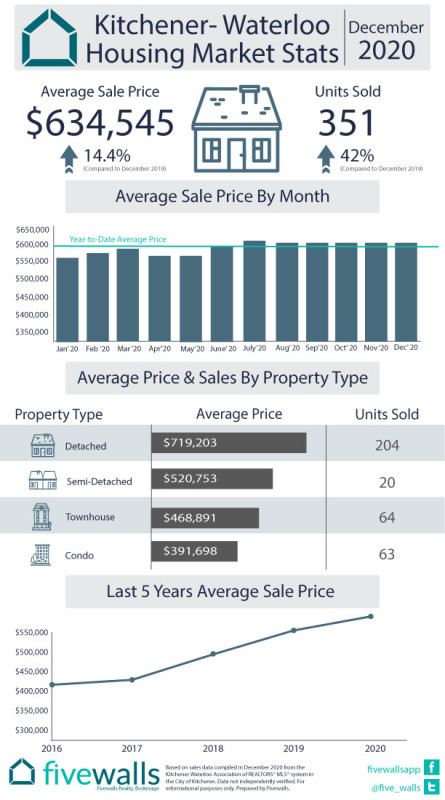
Despite being in the midst of a pandemic, a total of 6,492 residential homes changed hands in 2020 in the area, according to figures released by the Kitchener-Waterloo Association of Realtors (KWAR).
It says that figure, which includes detached houses, semis, condos and townhouses, is nine per cent higher than in 2019.
November 2020

November home sales represented an increase of 35% compared to the same month last year, according to the K-W Association of Realtors' monthly market update. It says the 10-year average for residential sales for the month of November is 433.
“We are now well beyond any pent-up demand from the first lockdown,” said Nicole Pohl, newly elected president of KWAR, in a release. “Now we’re simply dealing with straight-up demand for our community as an attractive place to put down roots, and the current COVID-19 pandemic is only further fuelling the already hot market and elevating Waterloo region as a desirable place to own a home.”
October 2020

Housing prices in Kitchener-Waterloo have held steady over the past few months but remain well above what they were in 2019.
The Kitchener Waterloo Association of Realtors (KWAR) said the average sale price of a home was $635,301 in October, which was 19 per cent above the figure for October 2019, when it was $533,288.
While that is a big yearly jump, it is similar to sales prices from the last three months as the average price was $637,691 in September, $634,409 in August and $639,814 in July.
September 2020

Housing prices continue to hold steady in the Kitchener-Waterloo market although they remain dramatically higher than a year ago, according to numbers released by the Kitchener-Waterloo Association of Realtors (KWAR).
The realtors’ group says that the average sales price of a home in the area was to $637,691 in September, about 17.5 per cent higher than it was in September 2019.
August 2020

Home prices have remained high in the Kitchener-Waterloo area in August. While year-over-year numbers saw a dramatic increase to $634,409 this year compared to $524,482 in 2019, the average cost of a home actually decreased slightly from July. “This summer, local home sales rebounded from the COVID-19 slow down we had in the spring,” KWAR President Colleen Koehler said in a release. “While not as heated as July, August sales were another month for the record books, as home buyers returned to the market with renewed intensity.”
July 2020

“Competition was high for buyers looking to lock down a house in July,” said Colleen Koehler, President of Kitchener-Waterloo Association of REALTORS®. “The rate of home sales in July resembled the kind of month we would normally see in May, and I chalk up much of that to the pent up demand that built as we moved into Stage 3 of reopening in mid-July.”
Get listing alerts straight to your inbox
Thank you! We’ll be in touch.
Get house alerts from top-rated real estate agents, it’s free!
{{subscribeError}}
June 2020
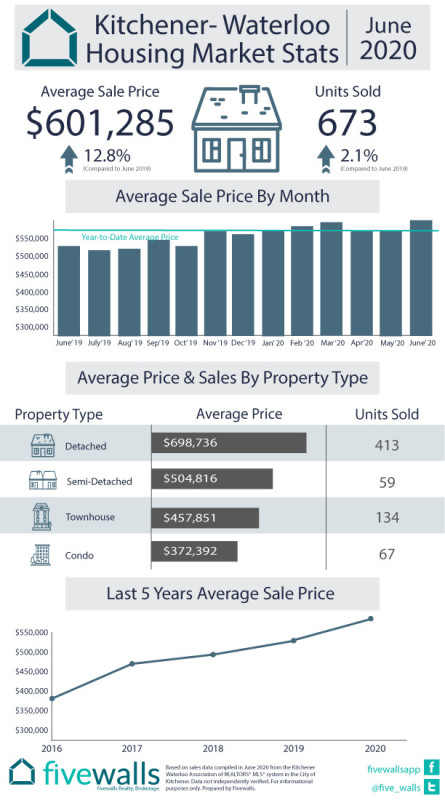
The average cost of buying a home in Kitchener-Waterloo skyrocketed last month as the local real estate market recovered from the coronavirus pandemic in a big way. The Kitchener-Waterloo Association of Realtors (KWAR) says the average cost of buying a home was $601,285, the first time it has crossed the $600,000 mark.
May 2020

“In May we saw the strong appetite for homes in the Kitchener-Waterloo area is still very much alive,” said Coleen Koehler, president of KWAR. “But as the virus continued to circulate in the community many would-be sellers were reluctant to put their homes on the market. For the homebuyers who cannot wait out the pandemic, they are not finding any fire sales as homes are not only maintaining their value, but also increasing.”
April 2020

April home sales saw a drastic fall of 63.6% compared to April of 2019. However, it isn't all bad news as Kitchener-Waterloo home prices held steady to an average price of $568,738 a 7.3% increase over the previous year.
Housing market inside scoop
Thank you! We’ll be in touch.
Sign up to get news before everyone else!
{{subscribeError}}
March 2020

Kitchener-Waterloo saw strong home sales in March 2020 with 577 residential homes sold. This was an increase of 13.1% compared to the same month last year and a 0.2% increase above the previous 5-year average. The average sale price also saw an increase in January to $583,752, a 15.3% increase from last year at this time.
February 2020

Kitchener-Waterloo saw strong home sales in February 2020 with 467 residential homes sold. This was an increase of 36.5% compared to the same month last year and a 15.3% increase above the previous 10-year average. The average sale price also saw an increase in February to $571,023, a 16.3% increase from last year at this time.
Got more housing market questions about the area? Talk to a knowledgeable Kitchener-Waterloo realtor.


